Interactive practice questions
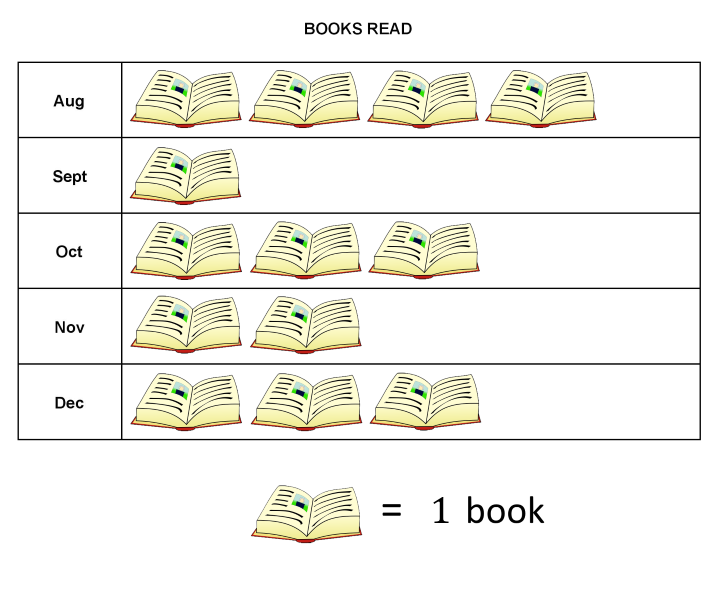
The pictograph shows the number of books a student read during each month.

a
How many books did the student read in September?
b
In which month did the student read $2$2 books?
August
A
December
B
November
C
October
D
c
In which month were the most amount of books read?
December
A
August
B
September
C
October
D
d
How many books did the student read altogether in December and October?
Easy
< 1min
The pictograph shows the amount of hours a student spent this month doing homework for different subjects.
Easy
1min
The pictograph shows the amount of cars a car dealer sold on each day of the week.
Easy
1min
The pictograph shows the merit points received by six students in a class.
Medium
1min
Sign up to access Practice Questions
Get full access to our content with a Mathspace account