topic badge

5.09 Graphs of exponential functions

Graphs of exponential functions

To draw the graph of an exponential function, we can use a variety of strategies, including:

  • Completing a table of values for the function and drawing the curve through the points found
  • Using technology, such as a physical or online graphing calculator
  • Identifying transformations from the equation

Exploration

The graph of y=2^x is shown. Slide the two sliders to transform the graph of y=a\left(2\right)^x+k.

Loading interactive...
  1. Which variable(s) change the horizontal asymptote?

  2. Which variable(s) change the shape of the graph?

  3. Which variable(s) change the y-intercept?

  4. Set the k slider to k=0. Describe the graph when a is positive. Describe the graph when a is negative.

  5. Set the a slider to a=1. Describe what happens when k is positive. Describe what happens when k is negative.

An exponential function could also undergo transformations based on the leading coefficient, a, and vertical shift, k:

\displaystyle f\left(x\right)=ab^x + k
\bm{a}
The y-intercept
\bm{b}
The constant factor
\bm{k}
Vertical shift

The y-intercept is the value of a. We can check this by substituting x=0 in the function: y=ab^0. Since b^0=1, the y-intercept is (0,\,a).

For k \gt 0, the graph will shift up k units. For k \lt 0, the graph will shift down k units.

-4
-3
-2
-1
1
2
3
4
x
2
4
6
8
10
12
14
16
y
Parent Function f(x) = 2^x
-4
-3
-2
-1
1
2
3
4
x
2
4
6
8
10
12
14
16
y
Vertical shift 4 units up f(x) = 2^x + 4

The key features of an exponential function can be found in both the equation and the graph.

Given f(x)=ab^x, the leading coefficient, a, represents the y-intercept and is plotted as the point (0,\,a). It also determines the range of the function.

  • When a \gt 0, the range is y \gt 0
  • When a \lt 0, the range is y \lt 0.

The value of a also affects the rate of change of the function. If two functions have the same value for b, a larger value for a will have a greater rate of change.

-2
-1
1
2
x
1
2
3
4
5
6
7
8
y
y \gt 0, Increases at an increasing rate
-2
-1
1
2
x
-8
-7
-6
-5
-4
-3
-2
-1
y
y \lt 0, Decreases at an increasing rate

The absolute value of a, tells us whether the graph's height will be made taller or shorter.

If \left\vert a \right\vert \gt 1, then every y-coordinate of the function is multiplied by a factor a that is greater than 1. The points on the graph move further away from the x-axis, increasing the steepness of the graph. This is called a vertical stretch.

If 0\lt \left\vert a \right\vert \lt 1, then every y-coordinate of the function is multiplied by a factor a that is between 0 and 1. The points on the graph move closer to the x-axis, decreasing the steepness of the graph. This is called a vertical compression.

Examples

Example 1

Consider the exponential function y=2.5\left(4\right)^x.

a

Draw the graph of the function.

Worked Solution
Create a strategy

We can identify both the y-intercept and constant factor from the equation since it is of the form y=ab^x. Using these two key features, we can plot other points to the left and right of the y-intercept and connect them with a smooth curve.

Apply the idea

The function has a constant factor of 4 since that is the base of the exponent, and a y-intercept at \left(0,\,2.5\right) as that is the coefficient.

We can start by plotting the y-intercept and choosing an appropriate scale.

-2
-1
1
2
x
5
10
15
20
25
30
35
40
y

We can see that the function will always be positive, so we don't need any negative y-values.

We know that the constant factor is 4. If we want to go from -2 to 2 on the x-axis, we need to go up to at least 2.5(4)^2=40 on the y-axis.

This would be an appropriate scale as it doesn't have too many labels or tick marks and is easy to read.

-2
-1
1
2
x
5
10
15
20
25
30
35
40
y

Either using a table of values or using the common ratio, we can plot another three points to get a good shape for the graph. Then we can connect the points with a smooth curve.

b

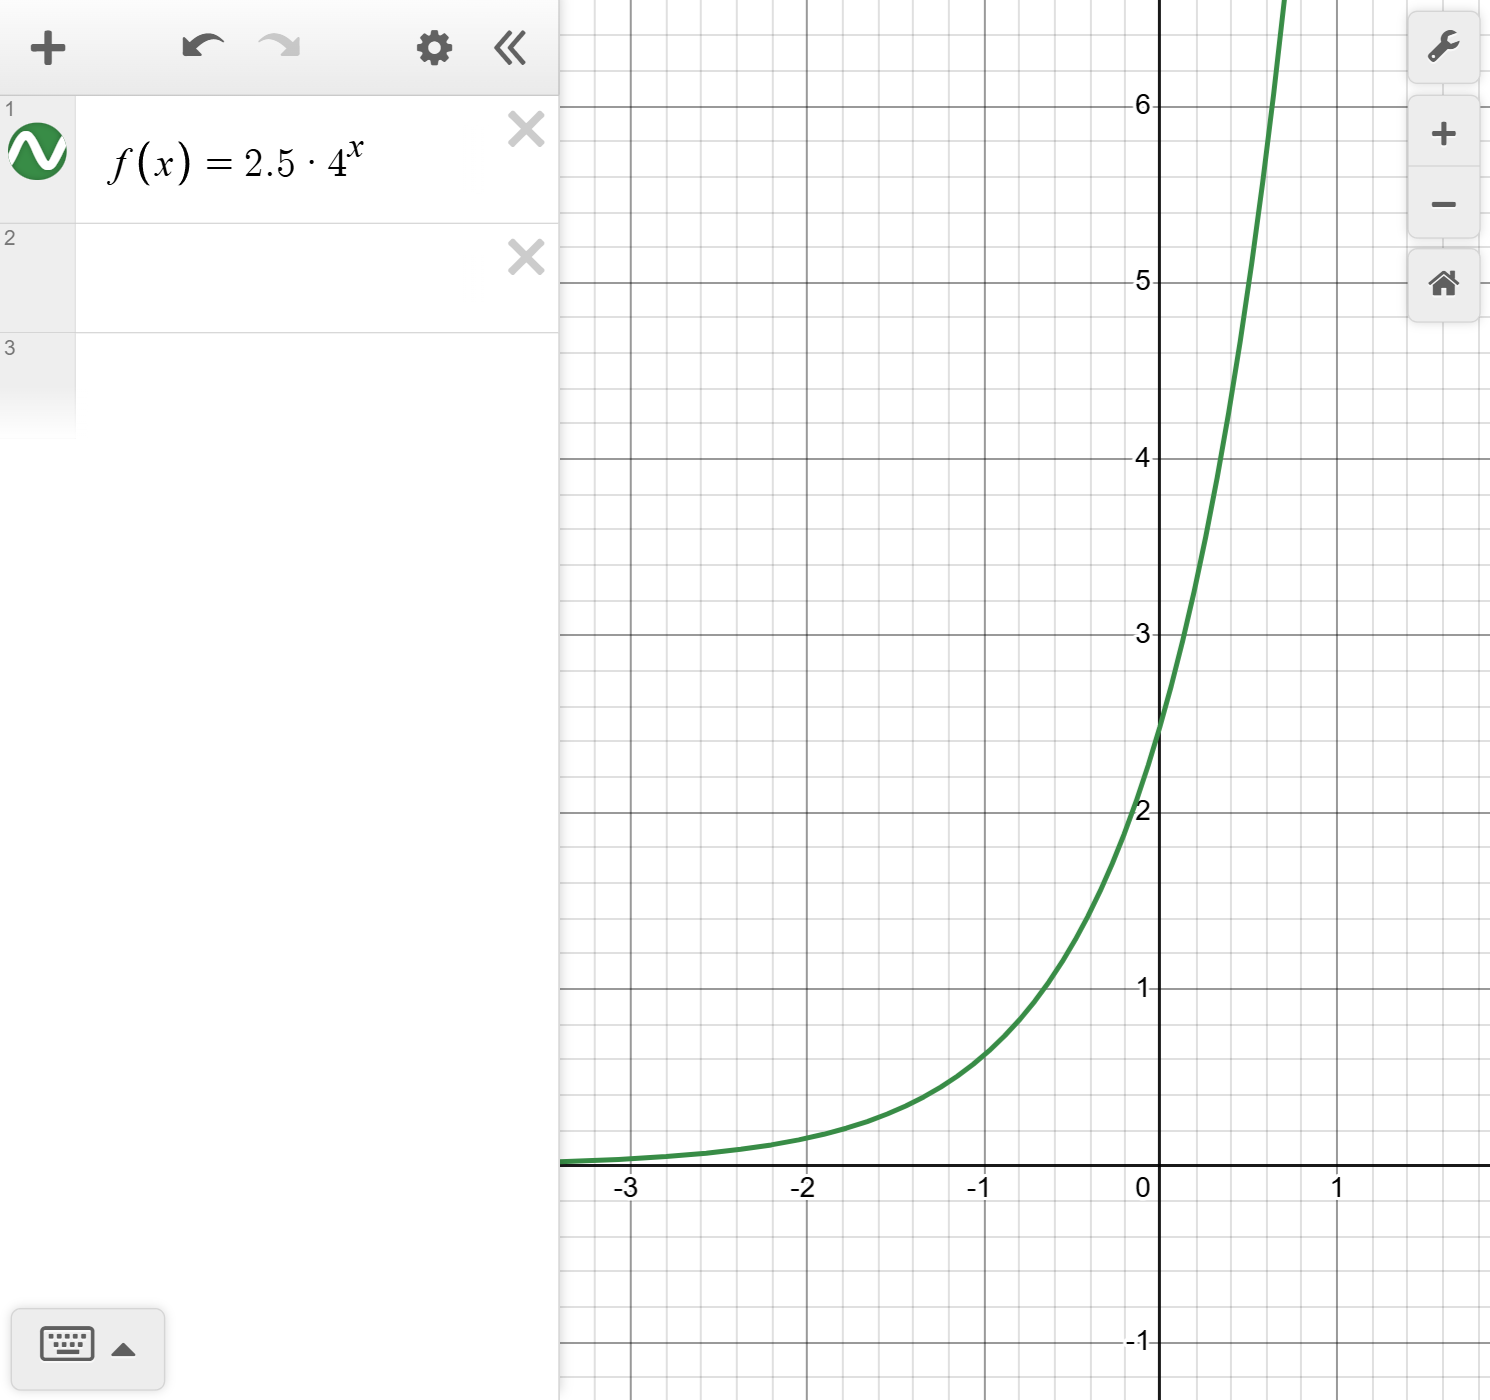
Check the graph from part (a) using technology.

Worked Solution
Create a strategy

When using a graphing calculator, there will typically be an input bar for functions. We just need to type out the function in the input bar. We need to be careful that we format our input correctly by using the correct buttons.

The GeoGebra calculator has a math input keyboard, but we can also use a computer keyboard.

  • Math input keyboard

    A figure showing how to input y equals 2.5 left parenthesis 4 right parenthesis raised to x. On the left of the figure is the equation y equals 2.5 left parenthesis 4 right parenthesis raised to x. It is followed by a left arrow pointing to a row of 9 keys. Starting from the leftmost key, the labels of the keys are: y, equal sign, 2, decimal point, 5, multiplication sign, 4, a box raised to smaller box, x.
  • Computer keyboard

    Two figures showing 2 ways of how to input y equals 2.5 left parenthesis 4 right parenthesis raised to x. On the left of the first figure is the equation y equals 2.5 left parenthesis 4 right parenthesis raised to x. It is followed by a left arrow pointing to a row of 10 keys. Starting from the leftmost key, the labels of the keys are: y, equal sign, 2, decimal point, 5, left parenthesis, 4, right parenthesis, caret, x. On the left of the second figure is the equation y equals 2.5 left parenthesis 4 right parenthesis raised to x. It is followed by a left arrow pointing to a row of 9 keys. Starting from the leftmost key, the labels of the keys are: y, equal sign, 2, decimal point, 5, asterisk, 4, caret, x.
Apply the idea

The graph should look the same as in part (a). We may need to change the axes or zoom settings to check.

A screenshot of the Desmos graphing calculator showing the graph of f of x equals 2.5 times 4 raised to x. Speak to your teacher for more details.
c

Without graphing, how would you expect this graph to look different than the graph of y = (4)^x

Worked Solution
Create a strategy

Remember how the leading coefficient and vertical shift can impact the graph.

Apply the idea

Since the leading coefficient, a, is greater than 1, we can expect the graph to have a greater rate of change and increase more quickly.

Example 2

In 2010, Bob counted 3 rabbits in his backyard. He noticed they double every week. Let f(x) describe this scenario, and use it to answer the questions below.

a

Find the y-intercept.

Worked Solution
Create a strategy

Imagine time in weeks as x, the independent variable. The y-interceptoccurs when x=0 at week 0 of counting.

Apply the idea
\displaystyle y\displaystyle =\displaystyle 3

The y-value of the y-intercept is the starting number of rabbits which is 3. The y-intercept is (0,\,3).

b

Write an equation describing this scenario.

Worked Solution
Create a strategy

Since the rabbits double every months, we can start by identifying the constant factor.

Apply the idea

We know our y-intercept, or a=3. Our constant factor b=2.

We can write our equation as f(x) = 3(2)^x.

c

Graph the function.

Worked Solution
Create a strategy

Draw the curve using the equation from part (b).

Apply the idea
-1
1
2
3
4
5
x
3
6
9
12
15
18
21
24
y

Example 3

Consider the function y=-4^{x} - 1:

a

Find the y-intercept.

Worked Solution
Create a strategy

Substitute x=0 into the function.

Apply the idea
\displaystyle y\displaystyle =\displaystyle -4^{x}-1Write the function
\displaystyle =\displaystyle -4^{0}-1Substitute x=0
\displaystyle =\displaystyle -2Evaluate
b

Graph the function as a transformation of the function f(x) = -4^x.

Worked Solution
Create a strategy

Start by graphing the function f(x) = -4^x.

-5
-4
-3
-2
-1
1
2
3
x
-14
-12
-10
-8
-6
-4
-2
y
Apply the idea

Draw the curve passing through each plotted point.

-5
-4
-3
-2
-1
1
2
3
x
-16
-14
-12
-10
-8
-6
-4
-2
y

This curve of the function y = -(4^{x}) - 1 must be shifted down 1 unit from the function f(x) = -(4^x).

Idea summary

We can use the y-intercept, the constant factor, b, and the vertical shift, k. to graph an exponential function in the form y=ab^x + k and identify key features:

  • When a \gt 0 and b \gt 1, the function is increasing at an increasing rate.
  • When a \lt 0 and b \gt 1, the function is decreasing at an increasing rate.
  • k \gt 0, will shift the graph k units up.
  • k \lt 0, will shift the graph k units down.
Outcomes

A.F.2

The student will investigate, analyze, and compare characteristics of functions, including quadratic and exponential functions, and model quadratic and exponential relationships.

A.F.2e

Given an equation or graph of an exponential function in the form y = ab^(x) (where b is limited to a natural number), interpret key characteristics, including y-intercepts and domain and range; interpret key characteristics as related to contextual situations, where applicable.

A.F.2f

Graph an exponential function, f(x), in two variables using a variety of strategies, including transformations f(x) + k and kf(x), where k is limited to rational values.

What is Mathspace

About Mathspace