topic badge

9.05 Analyze bivariate data

Analyze bivariate data

The process of analyzing bivariate data involves a two-step process. First, we plot the data on a scatterplot. This allows us to visually inspect the relationship between the two variables. Then, we use mathematical models to describe this relationship. Two common models that we have used are the linear regression model and the quadratic regression model.

Exploration

Check a box to show a linear or quadratic model. Drag the points with the blue circles to fit the model to the data on the graph.

Loading interactive...
  1. Which function fits the data better? How do you know?

To determine the curve of best fit for a set of bivariate data, we can use technology such as graphing calculators or software. These tools allow us to perform both linear and quadratic regression on the same set of data and compare the results.

To decide which curve best models the data, we can visually assess whether the curves follow the trend in the data and how close the points are to each curve. We can also use the context to determine if a model is a good fit.

\text{Time}
16
32
48
\text{Distance from ground (ft.)}

In the models shown, we can see the data points more closely follow the quadratic curve. Especially upon inspection of x-values closer to 0, the quadratic model more closely aligns with the data in the scatterplot. A better model will have data that is more tightly clustered along the curve.

Linear model

A type of relationship between two variables that can be expressed as a straight line on a graph. It is described by the equation y = mx + b, where m is the slope and b is the y-intercept.

Quadratic model

A type of relationship between two variables that can be expressed as a curve on a graph. It is described by the equation y = ax^{2} + bx + c, where a, \,b,\, and c are constants.

Examples

Example 1

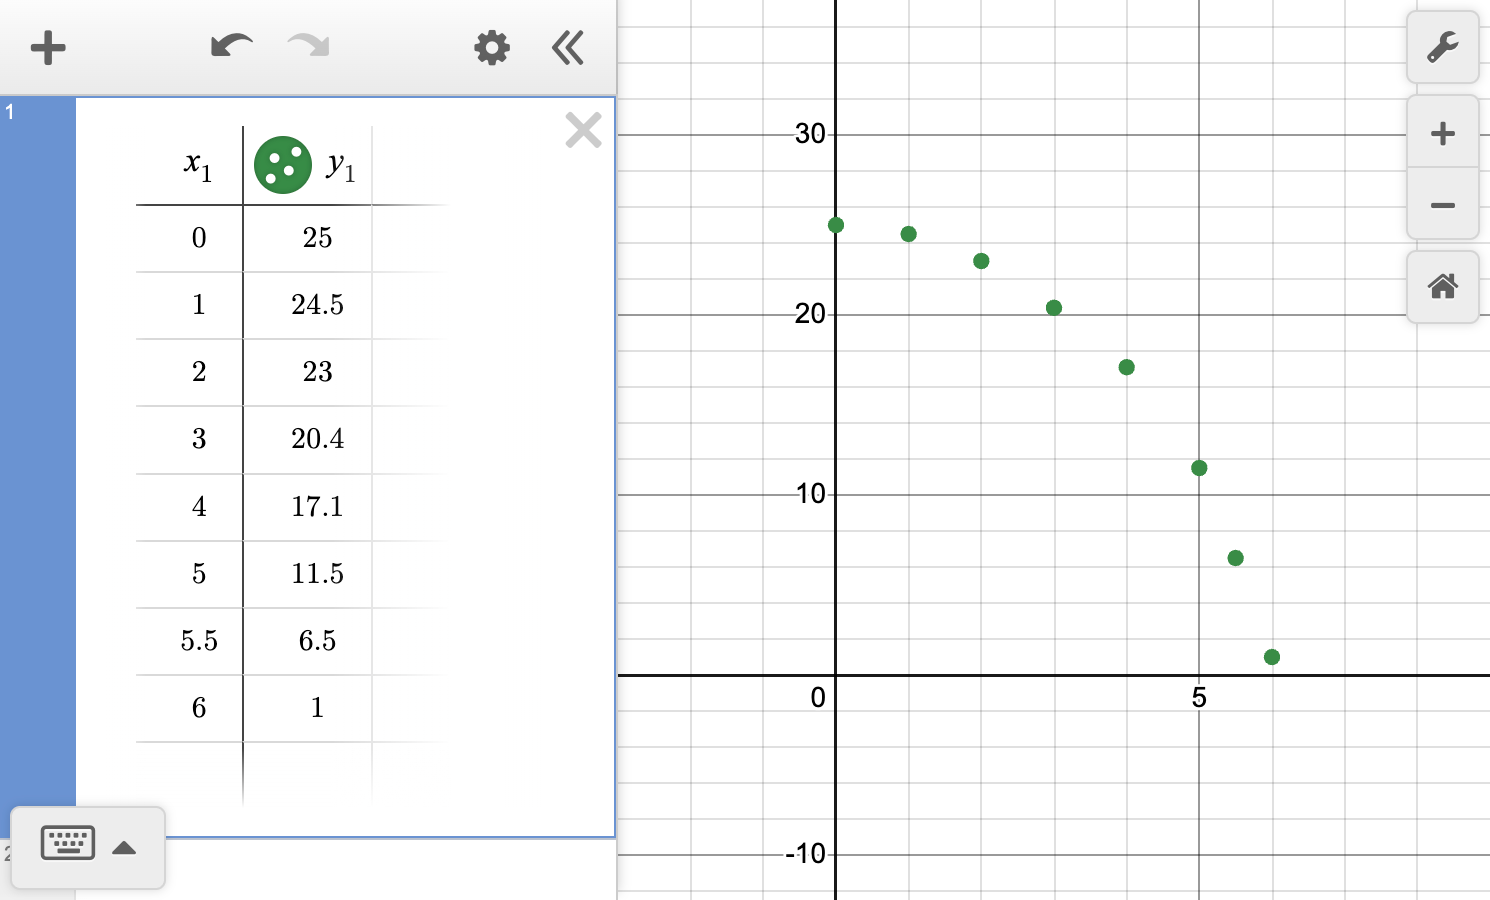
A ball is dropped off of a building that is 25 feet high. The table below shows its distance from the ground over time.

Time since being thrown (seconds)0123455.56
Distance from ground (feet)2524.52320.417.111.56.51
a

Describe the relationship between the time since the ball was dropped and its distance from the ground. Is it quadratic or linear?

Worked Solution
Create a strategy

Construct a scatterplot to get a visual of the data.

1
2
3
4
5
6
\text{Time since being dropped (seconds)}
5
10
15
20
25
\text{Distance from ground (feet)}

Then consider the form, strength, and direction.

Apply the idea

The data appears to fit a strong quadratic model.

b

Use technology to create a model and graph the model alongside a scatterplot of the data.

Worked Solution
Create a strategy

We can use technology to calculate the quadratic regression equation. Remember that a quadratic function is a polynomial of degree 2.

To find the equation using technology, we can follow these steps:

  1. Enter the x-values and y-values in two separate columns.

  2. Highlight the data and select Two Variable Regression Analysis.

  3. Under the Regression Model drop down menu, choose Polynomial. The degree drop down menu defaults to 2, which is a quadratic function.

Apply the idea
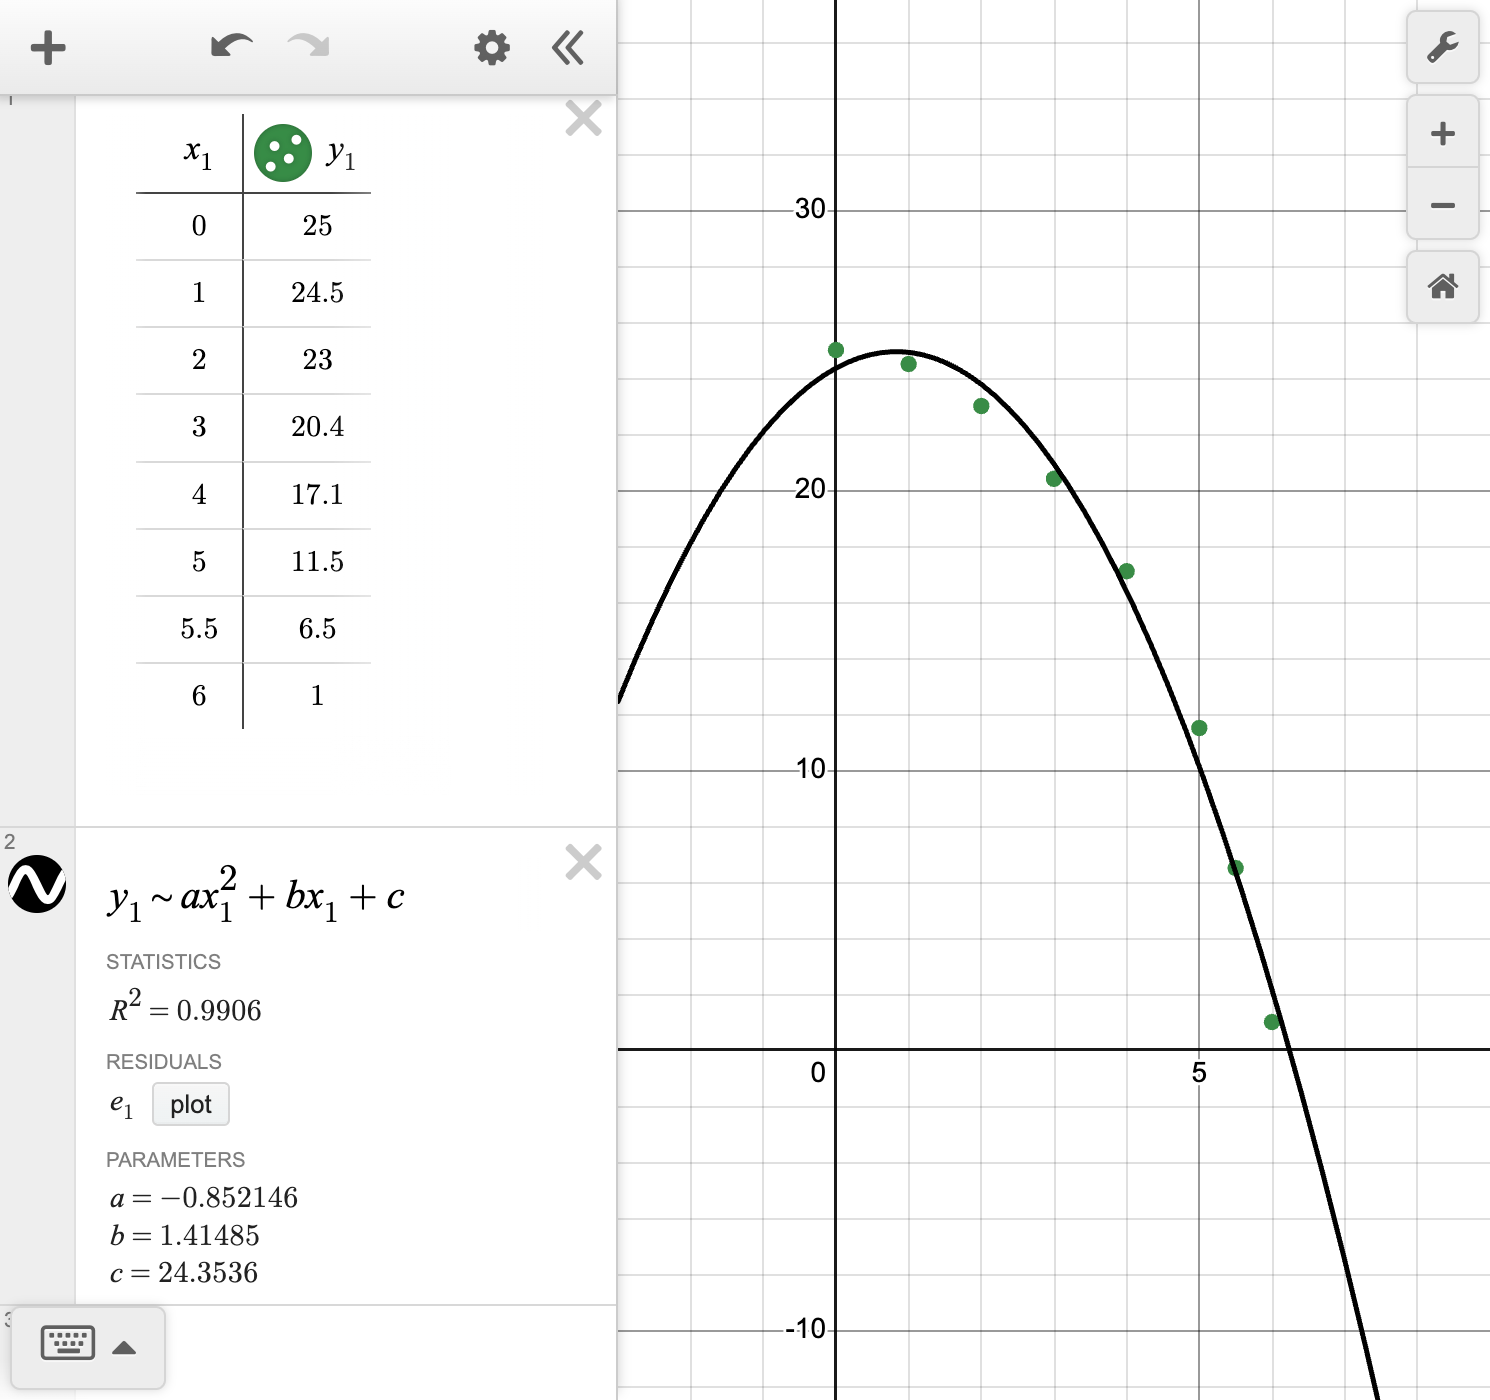
  1. Enter the x-values and y-values in two separate columns.

    A screenshot of the GeoGebra statistics tool showing how to enter a given set of data. Speak to your teacher for more details.
  2. Highlight the data and select Two Variable Regression Analysis.

    A screenshot of the GeoGebra statistics tool showing how to select the Two Variable Regression Analysis option. Speak to your teacher for more details.
  3. Under the Regression Model drop down menu, choose Polynomial. The degree drop down menu defaults to 2, which is a quadratic function.

    A screenshot of the GeoGebra statistics tool showing how to select the polynomial regression model option. Speak to your teacher for more details.

The equation of the curve of best fit is y = -0.8521x^2 + 1.4149x + 24.3536.

c

Based off your model, when would you predict the ball would hit the ground?

Worked Solution
Create a strategy

Looking at the graph, the ball would hit the ground when the distance from the groud is zero feet. Follow the pattern of the scatterplot or look at the model created using technology and predict when that would be. Alternatively, we can verify our solution by finding the x-intercept for our regression model.

Apply the idea

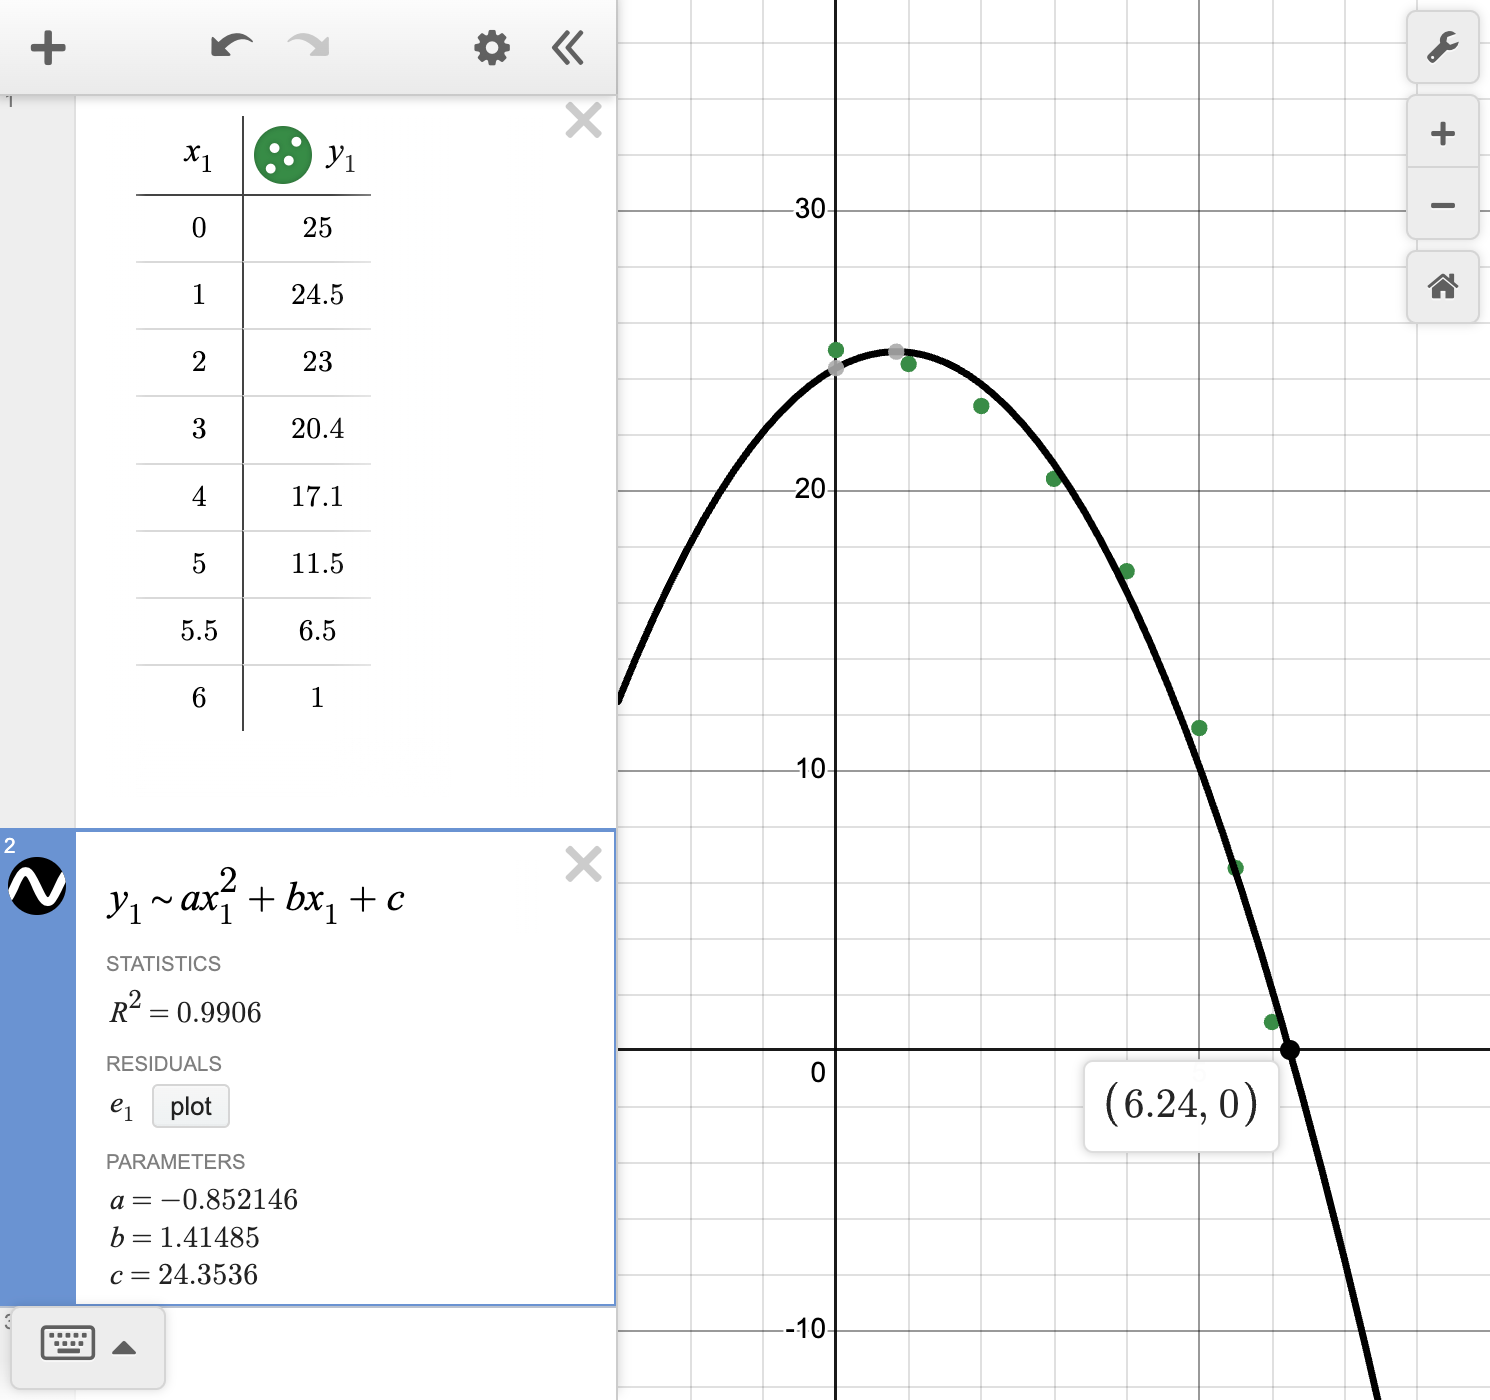
Looking at the model made with technology, the ball would hit the ground after approximately 6.25 seconds, which is the x-intercept when the distance from the ground is 0 feet.

Reflect and check

Remember, that this prediction is just an educated guess based on our model, and your answer may differ slightly based on the model you chose. According to this one, a more precise answer is about 6.24 seconds.

A screenshot of the GeoGebra statistics tool showing how to use the scatterplot to predict the value of y given a value of x. Speak to your teacher for more details.

Example 2

Ronaldo is looking to rent a two-bedroom apartment. He wants something that is spacious, but affordable. He decides to use the data cycle to explore rental options in his area.

a

Identify the two variables that Ronaldo should collect data for in his investigation of potential apartments and then formulate a statistical question to investigate them.

Worked Solution
Create a strategy

Consider the factors that Ronaldo is interested in:

  • A two-bedroom apartment

  • A spacious apartment

  • An affordable rental price

Then, determine which factors would require the collection of data.

Apply the idea

Ronaldo should collect data that describes the size of the apartment, usually measured by square footage, and the rental price, usually given as a monthly rate. The apartments should all have two bedrooms, since that is the type (category) of apartment he is interested in.

One possible question is, "What is the price range of two-bedroom apartments with 1000–1200 square feet?"

Reflect and check

In this context, the size of the apartment (in square feet) is the independent variable, and the monthly rental price (in dollars) is the dependent variable.

Other possible questions are:

  • How does the monthly rental price of a two-bedroom apartment change with the size of the apartment?

  • What size apartments are typically \$1500–\$1700 per month?

  • How do the prices and sizes of two-bedroom apartments compare to those of two-bedroom houses?

b

Collect data that could be used to answer the statistical question you formulated.

Worked Solution
Create a strategy

Previously, we determined that data should be collected on the size of the apartment, usually measured by square footage, and the rental price, usually given as a monthly rate.

This information can be acquired online. Typically, rental properties in an area are advertised on websites such as Zillow.com or Apartments.com.

Apply the idea

This is an example data set of current rental properties around Norfolk, VA:

Square footage1000140075511721200105011661195900900
Rental price2049217913241881177515001870207514251700
Square footage82213831183111385078388475010001224
Rental price1909215015001969160013501500140012991695
Square footage9808668029041250850750102511171027
Rental price1200149512601750170013501600155023001800
Reflect and check

Remember that the sample should be collected randomly, and there should be a decent amount of two-bedroom apartments in the sample to be representative of the population.

c

Determine whether a linear or quadratic function would represent the relationship best. Calculate the equation of the curve of best fit.

Worked Solution
Create a strategy

First, we can use technology to create a scatterplot and examine the shape of the data. After determining which function models the data best, we can find the equation of the curve of best fit with technology.

To find the equation using technology, we can follow these steps:

  1. Enter the x-values and y-values in two separate columns.

  2. Highlight the data and select Two Variable Regression Analysis. This will generate the scatterplot.

  3. Under the Regression Model drop down menu, choose Linear or Polynomial, depending on the shape of the data.

Apply the idea

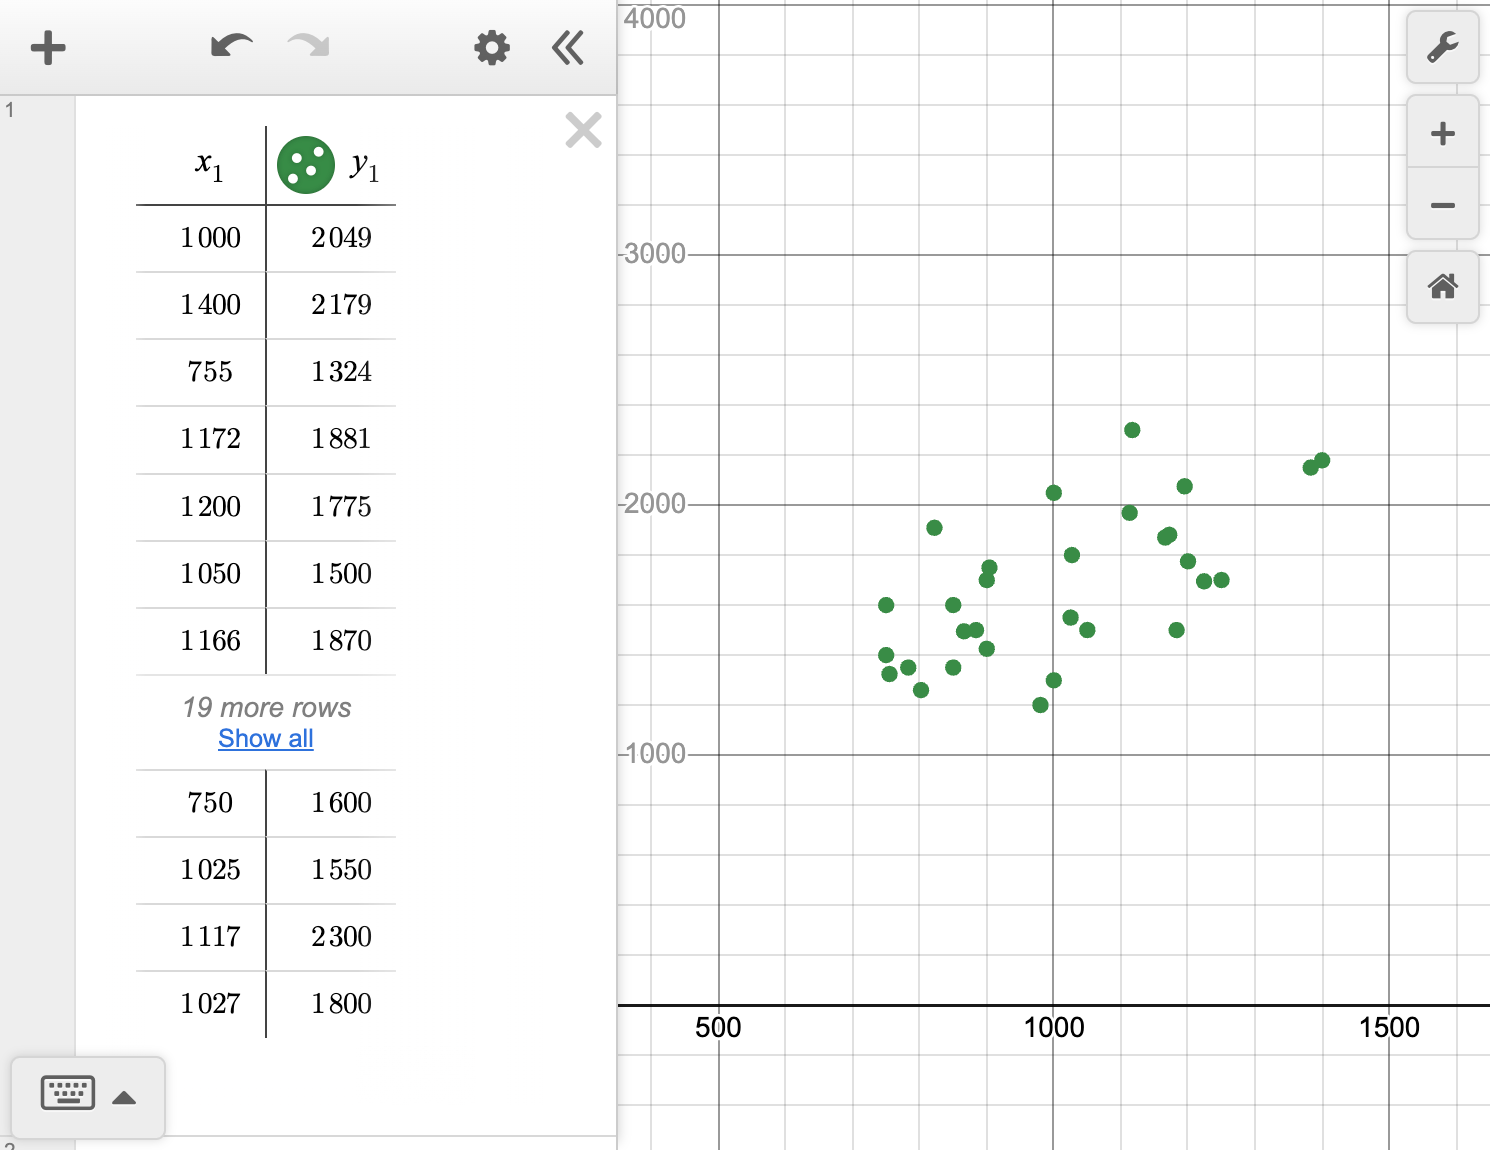
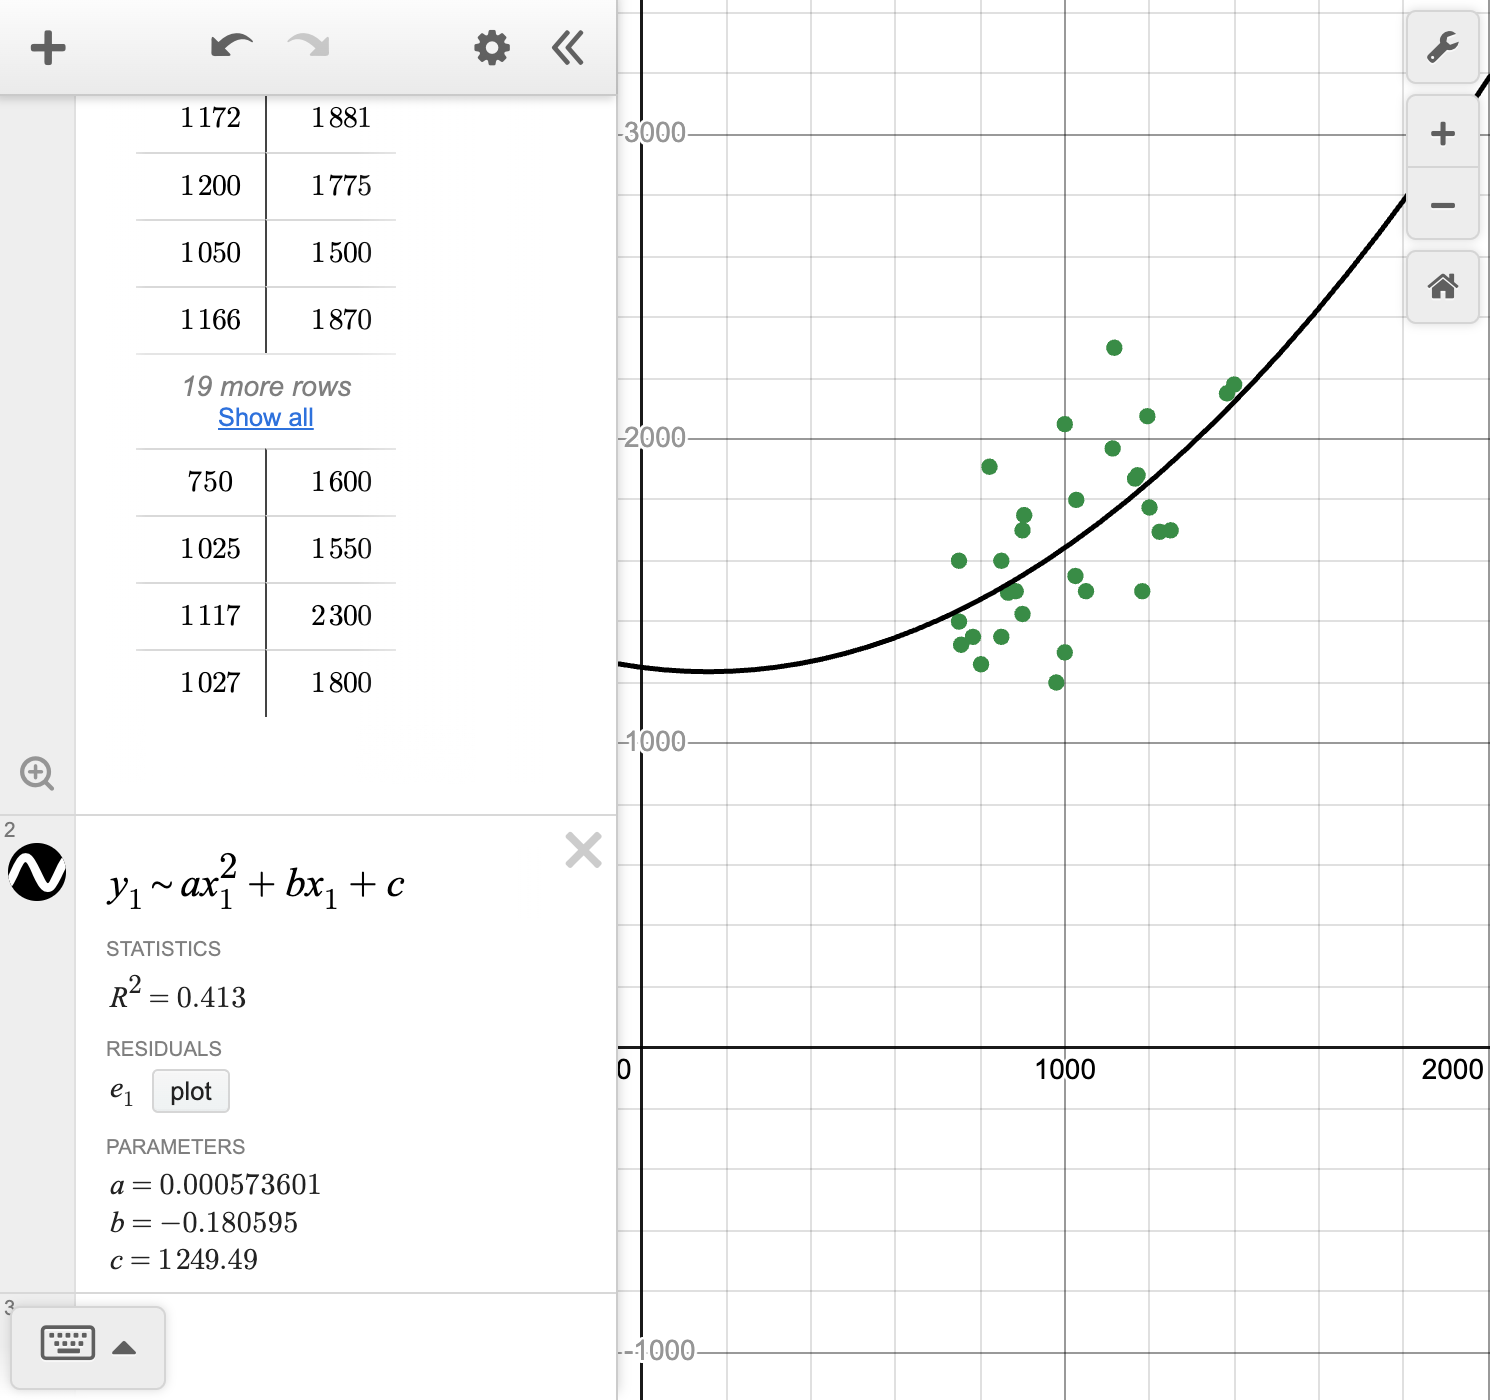
Enter the data into the GeoGebra statistics calculator, and perform the Two Variable Regression Analysis.

A screenshot of the GeoGebra statistics tool showing how to enter a given set of data and use the Two Variable Regression Analysis to create a scatterplot. Speak to your teacher for more details.

The relationship between the variables is not strong, but the y-values tend to increase as the x-values increase. This indicates there is a moderate, linear relationship between the variables.

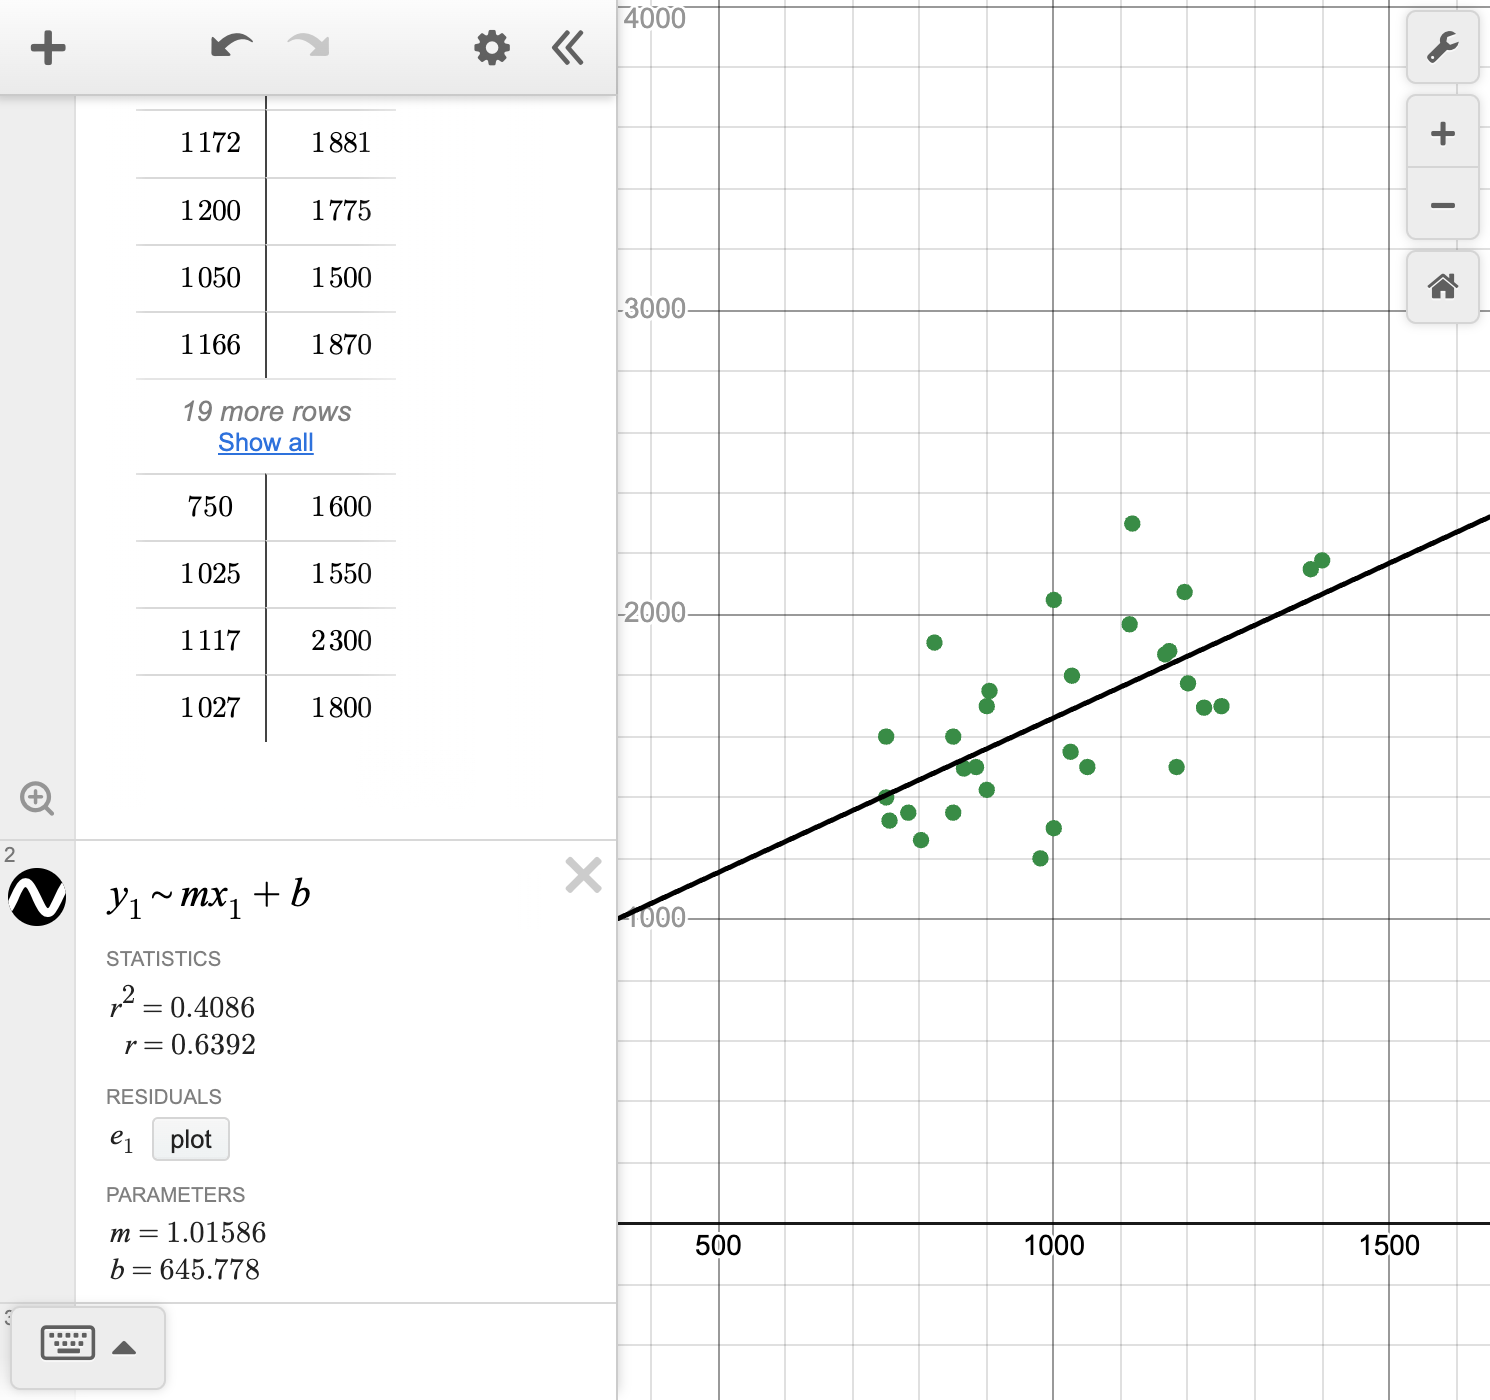
Now, we can find the equation of the line of best fit by choosing Linear under the Regression Model drop down menu.

A screenshot of the GeoGebra statistics tool showing how to show the linear regression model option. Speak to your teacher for more details.

The equation of the line of best fit is y=1.0159x+645.7778.

Reflect and check

When analyzing the quadratic curve of best fit, we can see that the curve does not model the data better than the linear model. In fact, the section of the parabola shown does not have much curve to it. This means that prediction made with either model would be similar.

A screenshot of the GeoGebra statistics tool showing how to show the polynomial regression model option. Speak to your teacher for more details.
d

Ideally, Ronaldo would like an apartment that is 1100\text{ ft}^2. Predict the monthly rental price of an apartment of this size.

Worked Solution
Create a strategy

In the previous part, we found the equation of the line of best fit to be y=1.01586x + 645.7778, where x represents the size of an apartment in square feet and y represents the monthly rental price in dollars. We can substitute x=1100 into the equation to find the monthly rental price.

Apply the idea
\displaystyle y\displaystyle =\displaystyle 1.0159x + 645.7778Line of best fit
\displaystyle =\displaystyle 1.0159\left(1100\right) + 645.7778Substitute x=1100
\displaystyle =\displaystyle 1763.2678Evaluate

An 1100\text{ ft}^2 apartment will cost about \$1763 per month.

Reflect and check

This prediction was made with interpolation because it falls within the range of the known data values. However, the prediction is not very strong because the points are not tightly clustered around the line.

e

Ronaldo's budget is \$1650. Predict the size of the apartment he can afford.

Worked Solution
Create a strategy

The monthly rental price is the dependent variable \left(y\right), and the size of the apartment is the independent variable \left(x\right). We must subsitute y=1650 into the equation of the line of best fit, and solve for the x-value.

Apply the idea
\displaystyle y\displaystyle =\displaystyle 1.0159x + 645.7778Line of best fit
\displaystyle 1650\displaystyle =\displaystyle 1.0159x + 645.7778Substitute y=1650
\displaystyle 1004.2222\displaystyle =\displaystyle 1.0159xSubtract 645.7778 from both sides
\displaystyle 988.505\displaystyle =\displaystyle xDivide both sides by 1.0159

\$1650 a month can get Ronaldo an apartment with about 988.5 square feet of space.

f

Draw a conclusion by answering the statistical question from part (b) and summarize the results of the investigation.

Worked Solution
Create a strategy

The statistical question from part (b) was, "What is the price range of two-bedroom apartments with 1000–1200 square feet?"

Apply the idea

If Ronaldo wants a two-bedroom apartment that is 1100\text{ ft}^2, he should expect to pay about \$1763 per month. This is outside of his budget, so he should look for apartments that are around 988\text{ ft}^2 to stay within his desired price range.

However, according to the raw data, the montly rental price of an apartment with 1000–1200 square feet ranges from \$1300–\$2300. This shows that it is possible to find an 1100\text{ ft}^2 apartment within the \$1650 price range.

There are most likely other factors, such as the neighborhood or distance from downtown Norfolk, that affect the price of the property that Ronaldo should take into consideration when making his final decision.

Reflect and check

These results could help Ronaldo make a decision about the apartment he would like to rent, or it could lead him to ask another question. For example, Ronaldo might ask the question, "How does the size of an apartment impact the monthly rental price of a one-bedroom or two-bedroom apartment?" He could use the slope of the line of best fit to conclude that for each 1 square foot increase in apartment size he can expect to pay around \$1.02 more per month.

This might lead Ronolado to explore one-bedroom apartments instead. He could repeat the data cycle, collecting data on one-bedroom apartment sizes and prices. Then, he can plot the data on the same scatterplot in part (d), but use a different color for the points representing one-bedroom apartments.

Idea summary

We can use technology to analyze bivariate data by creating and comparing regression models. To choose the model with the best fit, we analyze the visual fit on the scatterplot and the context of the problem. If the points are clustered more closely, the model is the better fit.

Outcomes

A.ST.1

The student will apply the data cycle (formulate questions; collect or acquire data; organize and represent data; and analyze data and communicate results) with a focus on representing bivariate data in scatterplots and determining the curve of best fit using linear and quadratic functions.

A.ST.1a

Formulate investigative questions that require the collection or acquisition of bivariate data.

A.ST.1b

Determine what variables could be used to explain a given contextual problem or situation or answer investigative questions.

A.ST.1c

Determine an appropriate method to collect a representative sample, which could include a simple random sample, to answer an investigative question.

A.ST.1d

Given a table of ordered pairs or a scatter plot representing no more than 30 data points, use available technology to determine whether a linear or quadratic function would represent the relationship, and if so, determine the equation of the curve of best fit.

A.ST.1e

Use linear and quadratic regression methods available through technology to write a linear or quadratic function that represents the data where appropriate and describe the strengths and weaknesses of the model.

A.ST.1f

Use a linear model to predict outcomes and evaluate the strength and validity of these predictions, including through the use of technology.

A.ST.1g

Investigate and explain the meaning of the rate of change (slope) and y-intercept (constant term) of a linear model in context.

A.ST.1h

Analyze relationships between two quantitative variables revealed in a scatterplot.

A.ST.1i

Make conclusions based on the analysis of a set of bivariate data and communicate the results.

What is Mathspace

About Mathspace